

Ah, the digital landscape – a vast expanse where data flows through networks like rivers, and applications are the busy harbors where user requests dock and set sail. But like any bustling port, without a keen eye on the comings and goings, chaos is but a misplaced cargo away. This is where the art and science of Site Reliability Engineering (SRE) shines, illuminating the waters of system operations with the lighthouse of observability. With the right SRE strategies for optimal observability, you can ensure that your digital harbor runs smoothly, come high tide or maelstrom.
- Key Takeaways
- Understanding Observability in SRE
- Key Observability Strategies in SRE
- The Right Tools for Observability
- Building an SRE Team for Observability
- Benefits of Enhanced Observability
- Machine Learning for Observability
- Continuous Improvement
- Final Thoughts on SRE Strategies for Optimal Observability
Key Takeaways
Dive into the heart of Site Reliability Engineering (SRE) with these 8 paramount strategies for achieving optimal observability:
- Embarking on the Observability Voyage – Grasp the essence of observability in the SRE realm, unveiling the triumvirate of logs, metrics, and traces.
- Mastering the Art of Logging – Harness categorization, consistency, and retention to transform logging into a powerful beacon of system behavior insight.
- Tuning into the Metrics Symphony – Keep a vigilant eye on performance metrics, error rates, and system utilization to gauge the pulse of system health.
- Weaving Tales with Tracing – Employ distributed tracing and correlation IDs to narrate and optimize the epic journey of transactions across the microservices realm.
- Tooling Up for Observability – Choose robust observability platforms and tools, your arsenal in the quest for effective observability.
- Assembling the SRE Legion – Build a formidable SRE team armed with essential skills and nurture a collaborative ethos between DevOps and SRE for a culture of continuous improvement.
- Summoning Machine Learning Magic – Embrace predictive analysis and anomaly detection, transitioning from a reactive to a proactive stronghold against system tribulations.
- Cultivating Continuous Improvement – Foster a culture of ceaseless learning and improvement to elevate observability and system reliability to new heights.
These strategies weave a comprehensive tapestry towards attaining optimal observability, empowering SREs in their crusade for enhanced system stability and performance.
Understanding Observability in SRE
Observability isn’t just a tech buzzword; it’s your radar in the stormy seas of site operations. It’s about having the right lenses to look deep into the system’s soul and understand its behavior and state. This piercing insight lets you spot a ripple in the waters before it becomes a wave, saving you from potential outages or performance hiccups.

In the realm of Site Reliability Engineering (SRE), observability isn’t a mere luxury; it’s a necessity. It’s the compass by which SREs navigate the complex channels of software systems, ensuring they remain reliable, available, and performing at peak efficiency.
Connection between SRE and Observability
SRE and observability are like two peas in a tech pod. While SRE provides the principles and practices, observability offers the tools and metrics. It’s like having a savvy captain (SRE) who knows the waters like the back of his hand, and a top-notch navigator (observability) armed with the best maps and compasses. Together, they steer the ship of site operations through calm and stormy weather alike, ensuring a smooth voyage towards high availability and stellar user experience.
Now, let’s delve into the toolkit of an SRE, shall we? The observability trinity – Logs, Metrics, and Traces, are the sextants and compasses for our digital navigators. Each has a role in painting a complete picture of our system’s landscape. So, let’s hoist the sails and set course to explore these key observability strategies in SRE.
Key Observability Strategies in SRE
Ah, the trinity of observability: Logs, Metrics, and Traces. Each plays a quintessential role in unfolding the narrative of your system’s performance and health. Let’s delve deeper into how these strategies are the compass, map, and spyglass for your SRE endeavors.
Logs: The Diary of System
Logs, the unsung heroes in the quest for system clarity, hold the chronicles of your system’s journey. Every event, error, and info message is a tale scripted in real-time, awaiting its moment to narrate the chronicles of system behavior. Effective logging is akin to having a seasoned bard in the realm of digital operations, whose ballads guide SREs through the maze of system events, leading to the heart of issues.
Importance of Logging in Observability
Logging lays down the breadcrumbs on the path of system behavior. It’s through these digital trails that SREs can retrace the steps of an issue to its lair. In a landscape where the tempest of issues could brew without a whisper, logs are the seer stones that unveil the brewing storms. And in a world where minutes of downtime can spell doom, logs are the compasses that lead to quicker resolution, ensuring the user experience remains unscathed.
- Capturing the Narrative: Logs capture the narrative of system operations, documenting each twist and turn, each success, and failure. They are the scriptures that hold the keys to understanding system behavior and performance.
- Correlation and Troubleshooting: When an outage looms, correlating log data across services helps in piecing together the puzzle, enabling a faster root cause analysis. It’s about connecting the dots between disparate pieces of information to troubleshoot the heart of the issue.
- Enhancing Observability: Logs enhance the tapestry of observability, interweaving with metrics and traces to render a holistic picture. They are the prose that complements the poetry of metrics and traces, enriching the observability narrative.
How to Log Effectively?
Effective logging is an art refined over time and experience, yet there are some best practices that serve as the brush strokes to this art.
- Categorization: Like a well-organized library, categorize logs into errors, warnings, and information. It’s about arranging the chronicles in a manner that simplifies the quest for knowledge.
- Consistency: Maintain a consistent log format to ensure readability and ease of analysis. Consistency in logging is like having a common language, simplifying communication and analysis.
- Retention: Retain logs for a duration that complies with both operational needs and legal requirements. It’s about preserving the tales that might be called upon to unravel future mysteries or reminisce past glories.
- Automation: Employ automation in log analysis to sift through the volumes of data, identifying patterns, and alerting anomalies. It’s about having a digital scribe that tirelessly keeps a vigil on the log data, ready to herald the onset of issues.
- Open Source and Cloud Native Tools: Embrace open source and cloud-native logging tools that not only optimize logging practices but also seamlessly integrate with the broader observability strategy. Tools like ELK Stack (Elasticsearch, Logstash, and Kibana) or cloud-native services like AWS CloudWatch Logs are akin to having a magnifying glass that unveils the finer details of log data.
In the grand scheme of observability, logs are the chronicles that hold the essence of system behavior. They are the silent sentinels that keep a meticulous record of the digital realm, ready to narrate the tales of yore and today, aiding SREs in their quest for reliability and excellence.
Metrics: The Pulse of Software
Metrics, the heartbeat of your system, pulse with the rhythm of your operations. They’re your digital stethoscope, tuning you into the cadence of your system, whether it beats with the vigor of performance or murmurs with the whispers of looming issues. They are the veins through which the lifeblood of performance and error data flows, revealing the vitality or the ailments of your software.

The lore of metrics extends into the kingdom of cybersecurity as well, where metrics morph into key performance indicators (KPIs), key risk indicators (KRIs), key goal indicators (KGIs), and critical success factors (CSFs). These are the noble houses in the realm of cybersecurity posture, each playing a pivotal role in fortifying the digital fortress against nefarious forces.
What Metrics to Monitor?
The realm of metrics is vast, yet selecting the right ones is akin to choosing the right vantage points to gaze upon a landscape. Here are some of the quintessential metrics:
- Performance Metrics: Performance metrics like response times and system throughput are the sprinters in the marathon of operations. They depict how swiftly and efficiently your system responds to the beck and call of requests.
- Error Rates: They’re the harbinger of discord in the digital harmony, the warning coughs before a full-blown system flu. Monitoring error rates help in early detection and remediation, keeping the bugs at bay.
- System Utilization: Monitoring metrics like CPU, memory, and disk usage is akin to ensuring your digital steed is well-fed and ready for the long haul. It’s about maintaining a well-oiled machine that scales gracefully with the tide of demand.
Correlation between Metrics and System Health
Metrics, when observed in isolation, are like musical notes devoid of a melody. It’s when they converge into a coherent narrative, that’s when the orchestra of insight plays.
- Interplay of Metrics: Correlating metrics help in understanding the interplay between different system components. It’s like watching a dance where each metric moves in tandem with others, reflecting the choreography of system operations.
- Holistic Health View: When metrics are aggregated and analyzed together, they paint a holistic picture of system health, providing a panorama of performance, errors, and system utilization. It’s about not just looking at the trees, but understanding the essence of the forest.
- Dashboard of Insights: Employing dashboards to visualize the convergence of metrics is akin to having a canvas where the story of system health unfolds. Dashboards are the lenses that bring the myriad metrics into focus, rendering a clear image of system vitality or the specter of issues.
- Alerts and Thresholds: Setting up alerts based on threshold values of correlated metrics is like having sentinels that raise the alarm at the first sign of trouble. It’s about being vigilant, ensuring that the guardians of alerting are well-versed with the rhythm of metrics to herald the onset of issues.
Optimizing with Metrics
- Microservices and Metrics: In a microservices architecture, metrics are the threads that bind the loosely coupled services, providing insight into the labyrinth of interactions. They are the beacons in the cloud-native fog, ensuring each microservice is performing optimally.
- Automation in Metric Analysis: Employing automation in metric analysis to detect anomalies or trends is like having a sage that discerns the whispers of change in the cacophony of operational data.
Metrics are the compass and the map in the voyage of observability. They are the silent whisperers of system tales, embodying the essence of Site Reliability Engineering. By tuning into the pulse of metrics, SREs can traverse the path of proactive remediation, ensuring a harmonious user experience and a scalable, reliable system.
The alliance between DevOps and SRE practices and cybersecurity metrics is a testament to the symbiotic relationships that burgeon in the digital ecosystem. Metrics, whether monitoring processes, system performance or cybersecurity posture, are the beacons that guide SREs and cybersecurity knights alike through the murky waters of the digital realm.
For a deeper dive into how metrics play into cybersecurity posture, march forth to this treasure trove of knowledge.
Tracing: The Storyteller of Transactions
Tracing is the lore-master of your system, narrating the saga of a transaction as it journeys through the microservices realm.

Significance of Tracing
In the microservices world, a single transaction’s tale is told across numerous services, each service like a chapter in the saga. Tracing, the seasoned bard, stitches together these dispersed narratives, weaving a coherent story that unveils the mysteries of the transaction’s journey. This narrative is critical for SREs to understand, debug, and optimize the transaction journey, ensuring a tale of triumph rather than a tragedy of latency.
Effective Tracing Strategies
- Distributed Tracing: Embrace the art of distributed tracing to follow the epic of transactions across the sprawling landscape of services. It’s about having a bird’s eye view of the transaction journey, identifying where the plot thickens, and where latency dragons lurk.
- Correlation IDs: Employ correlation IDs as the golden threads that stitch together the tale of transactions, making troubleshooting a less Herculean task. With a correlation ID, the chapters of a transaction saga are bound together, enabling a swift journey from the symptom to the root cause of the problem.
- Telemetry Data Collection: Harvest the golden grains of telemetry data as your transactions traverse through the microservices realm. This data is the ink with which the tracing lore-master pens down the transaction saga.
Tracing isn’t just a storyteller but a sage, offering precious pearls of wisdom that guide the SREs and engineering teams towards the holy grail of optimal system performance and reliability. Through tracing, the chronicles of transactions are not just narrated but optimized, ensuring each tale is one of triumph over the nefarious latency and error demons.
The Right Tools for Observability
Observability is a realm where the right tools not only empower but redefine what’s possible. Like a master blacksmith with a well-forged toolset, having the right observability tools at your disposal is crucial.

Observability Platforms
Ah, the modern-day observability platforms! They’re like the observatories of old, granting SREs a panoramic view of the digital cosmos. These platforms are the astrolabes and sextants for the modern-day digital navigators, aggregating logs, metrics, and traces under one roof. They offer a single pane of glass through which the health and performance of systems are scrutinized, rendering the invisible, visible and the obscure, clear.
Some notable players in this domain include:
- Splunk: Known for its log management capabilities, it dives deep into data lakes, fishing out insights critical for system health and performance.
- Datadog: A watchdog for your system, barking (or rather, alerting) at the first signs of trouble, ensuring nothing slips past unnoticed.
- New Relic: Like a new relic of observability, it unearths the buried treasures of system data, illuminating the path to performance optimization.
- Elastic (ELK Stack): The trinity of Elasticsearch, Logstash, and Kibana, it’s like the Three Musketeers of data search, analysis, and visualization.
Cloud-based Observability Tools
In the towering clouds, observability tools float, offering a bird’s eye view of your digital operations. These tools are tailored to meet the demands of cloud-native environments, ensuring seamless operations in the ephemeral cloud realms.
Some of the cloud giants and their offerings include:
- AWS: With tools like CloudWatch and X-Ray, AWS ensures you’re never in the dark about your system’s state and performance.
- Google Cloud: Stackdriver is the vanguard of observability in the GCP realm, a vigilant sentinel overseeing your cloud operations.
- Azure: Azure Monitor and Application Insights stand as the watchtowers, keeping a steady eye over your cloud kingdom, ensuring tranquility reigns over your digital dominion.
These observability tools are the companions of SREs, the eyes and ears through which they perceive the digital world, ensuring a realm of reliability, performance, and seamless user experiences. They are not just tools, but extensions of the SRE’s senses, a means to perceive, understand, and act in the ever-evolving digital landscape. And as we embrace these tools, we step into a realm of heightened awareness and control, steering our digital vessels through turbulent waters towards the shores of reliability and excellence.
Building an SRE Team for Observability
Observability isn’t a solo expedition but a team endeavor. The quest for seamless user experience and system stability is akin to a fellowship embarking on a quest through the digital Middle-Earth. And like any formidable fellowship, the composition is crucial.
Skills Required
In the digital orchestra, an SRE team plays a symphony of stability and performance. Here’s a glimpse of the virtuoso skills that compose the melody of reliability:
- Problem-Solving Prowess: The ability to dissect complex system issues, troubleshoot the root cause, and orchestrate a solution is the hallmark of an SRE maestro.
- System Internals Savvy: A deep dive into the abyss of system internals isn’t for the faint-hearted. A solid grasp of system architecture, network protocols, and the cloud native landscape is vital.
- Automation Artistry: Automation is the magic wand that banishes repetitive, mundane tasks, freeing the SREs to focus on optimizing and enhancing system performance.
- Metric Mastery: Being adept at defining, collecting, and interpreting metrics is akin to reading the tea leaves of system health.
- Log Lore: Logs are the cryptic scrolls where system secrets are inscribed. The ability to decipher log data is crucial for tracing the tales of transactions and operations.
- Alert Acumen: Crafting meaningful alerts that serve as the clarion call of potential issues is a skill that steels the system against unwarranted outages.

Collaborative Practices between DevOps and SRE
Ah, the dance between DevOps and SRE – a ballet that when choreographed right, leads to a harmonious, agile, and reliable system operation. Their dance floor is the stage of continuous delivery, and their rhythm is the beat of automation and observability.
- Shared Vision: Both SREs and DevOps are crusaders of reliability and agility. Establishing a shared vision fortifies the bridge between development and operations, ensuring a seamless flow of code from the forge to the frontlines.
- Continuous Improvement Culture: The ethos of continuous improvement is the choreography that keeps the dance fluid. It’s about learning from every stumble, every misstep, and coming back with a refined step.
- Observability Strategy Integration: Integrating observability strategy within the DevOps pipeline is like having a spotlight on the dance floor, illuminating areas that require a refined choreography.
- Open Source Overture: Embracing open source observability tools not only democratizes observability but fosters a culture of collaboration and innovation.
- Dashboard Dramaturgy: Crafting dashboards that provide a panoramic view of system health, performance, and the user experience, is akin to having a well-scripted play that narrates the tale of system operations.
The duet of DevOps and SRE, backed by a chorus of observability tools, metrics, logs, and alerts, orchestrates a narrative of reliability and performance. It’s a narrative where outages are but an interlude, not an epilogue, and where the user experience is the hero of the tale. The realm of observability is vast, and the quest for reliability is endless, but with a well-composed SRE team and a harmonious collaboration with DevOps, the melody of reliability resonates through the digital landscape.
Benefits of Enhanced Observability
The odyssey of implementing observability unfurls a panorama of benefits, akin to the myriad stars that adorn the night sky in the realm of platform engineering. Let’s traverse through this landscape and unearth the treasures that enhanced observability brings to the table.

Improved Site Reliability
Ah, the lofty realm of site reliability, where the difference between monitoring and observability unveils itself like the dawn breaking the veil of night. Enhanced observability is the compass that SRE teams need, guiding them through the labyrinth of distributed systems with the torch of clarity. It’s the essence of SRE principles in action, where each log, metric, and trace is a thread in the tapestry of system observability, illuminating the state of the system.
- Proactive Troubleshooting: With enhanced observability, our gallant SRE knights can proactively venture into the heart of issues, armed with the right questions and the means to quickly pinpoint the root cause.
- Highly Reliable Software Systems: Observability allows the crafting of highly reliable software systems, fortifying the digital dominion against the siege of downtimes and performance aberrations.
Faster Issue Detection and Resolution
In the grand chessboard of system operations, enhanced observability is the queen, boasting the prowess to swiftly maneuver across the board and checkmate issues.
- Quickly Pinpoint Issues: The lexicon of enhanced observability is rich with tracing information and logs, empowering SRE teams to quickly pinpoint issues and orchestrate a symphony of resolutions.
- Reduce the Number of Requests: A well-tuned observability set is the maestro that orchestrates a reduction in the number of requests bouncing between operations and development teams, thus fostering a culture where teams can use observability tools to self-service answers.
Unveiling the Unknown
The enigmatic veil that often shrouds system behaviors begins to lift with the magic of enhanced observability.
- Right Observability Strategy: The narrative of implementing SRE practices is enriched with the right observability strategy, making the quest for a highly reliable and resilient system an engaging saga rather than a grueling ordeal.
- Application Monitoring: The eyes of enhanced observability, through application monitoring, keep a vigilant watch, ensuring that the orchestration of system components is in harmony.
As we saunter through the garden of enhanced observability benefits, it’s akin to turning the pages of an insightful tome, where each benefit is a chapter that enriches the organization’s narrative, making it easier for operations teams to focus on elevating the user experience rather than getting ensnared in the quagmire of system anomalies. The beauty of observability is not just in the telling but in the foretelling, a realm where data doesn’t just narrate tales but foretells the sagas of system performance, preparing the SRE knights in their quest for a realm free of downtimes and performance hiccups.
Machine Learning for Observability
In the grand theatre of system operations, Machine Learning (ML) plays the soothsayer, gazing into the data to foretell performance fortunes. It’s not about gazing into a crystal ball, but diving into oceans of data to find patterns and predict potential system tribulations before they morph into full-blown crises. ML, when integrated into an observability strategy, acts as the oracle for Site Reliability Engineering (SRE), rendering the invisible intricacies of system behavior visible and decipherable.

Predictive Analysis
Predictive analysis, the harbinger of what’s to come, allows SREs to transition from a reactive stance to a proactive one. It’s akin to having a digital weather vane, indicating the winds of system performance.
- Analyzing Past Behavior: By analyzing past system behavior, predictive models can forecast potential issues, be it an impending resource crunch or a pattern of errors signaling a deeper malaise. This analysis dives into the historical log and metric data, unraveling the tales they tell.
- Forecasting Resource Needs: Predictive analysis can also play a pivotal role in capacity planning, helping to optimize resource allocation, and thereby ensuring a scalable and cost-effective operation.
- Alerts Before Storms: Establishing alerts based on predictive analysis is like having a watchtower, from where the first signs of a digital storm can be spotted. This early warning system enables SREs to prepare and act before a minor issue swells into a catastrophic outage.
Anomaly Detection
Now, here’s where ML shines like a knight’s polished armor under the sun. Anomaly detection algorithms sift through the haystack of metrics and logs, pinpointing the needles of anomalies.
- Sifting Through Metrics and Logs: In the vast seas of observability data, anomalies are like elusive sea monsters. ML-based anomaly detection is the harpoon that helps in catching these anomalies amidst the waves of normal operations.
- Automated Troubleshooting: The power to automate troubleshooting by correlating anomalies to potential root causes is like having an auto-navigating compass that leads SREs straight to the heart of the problem.
- Enhanced User Experience: By swiftly identifying and resolving anomalies, the user experience remains unmarred by the ripples of system issues. It’s about ensuring smooth sailing even when the undercurrents of system data roil with potential problems.
Tailoring ML to Observability
Adopting ML in the realm of observability isn’t a plug-and-play affair. It requires a well-thought-out strategy, tailored to the unique choreography of your systems and operations.
- Open Source and Cloud Native Tools: The open source community and cloud-native landscape offer a trove of ML tools and frameworks. Tools like TensorFlow and cloud-native ML services can be leveraged to build and deploy models tailored to your observability needs.
- Collaboration between DevOps and SREs: The synergy between DevOps and SREs is crucial for successfully integrating ML into observability. It’s about orchestrating a ballet where ML models dance to the tune of observability data, bringing forth insights that guide the SREs in their quest for reliability and performance.
The incorporation of Machine Learning in observability is like adding a sage to the SRE council, one who speaks the arcane language of data, offering insights that drive proactive strategies, ensuring the kingdom of your digital operations remains steadfast against the onslaught of issues and outages.
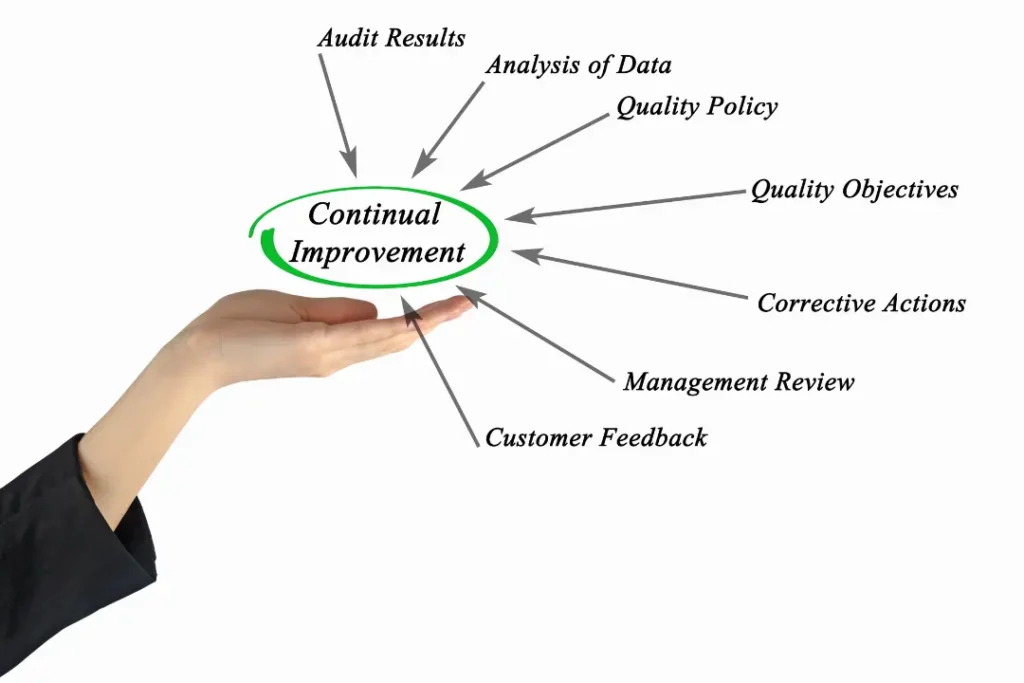
Continuous Improvement
The ethos of continuous improvement in Site Reliability Engineering (SRE) is akin to the relentless refining of a master craftsman’s tools. It’s not just about having an observability solution in place, but about perpetually sharpening it to mirror the ever-evolving landscape of software engineering. Let’s delve deeper into the elements that fuel this narrative of continuous improvement.
Embracing SRE Best Practices
Adherence to SRE best practices is the cornerstone of nurturing a culture rooted in continuous improvement. It’s about marrying the principles of software engineering with observability best practices to script a narrative of system reliability and performance that’s nothing short of a magnum opus.
- Monitoring and Observability: Understanding the fine line between monitoring and observability is pivotal. While monitoring sounds the alarms at the onset of a storm, observability is the compass that navigates through the storm, providing insights into system performance that’s invaluable in calibrating the sails towards calmer seas.
- Strategies and Best Practices: Embedding strategies and best practices into the workflow, from incident management to logging and tracing, crafts a robust framework that fuels the engine of continuous improvement.
Measuring and Improving
Metrics like Mean Time to Recovery (MTTR), Mean Time to Detect (MTTD), and Mean Time to Resolve (MTTR) are the barometers of continuous improvement. They provide the narrative of where we are, illuminating the path towards where we need to be.
- Customer Experience: At the heart of all endeavors is the quest to enhance customer experience. It’s about ensuring the tale of system reliability and performance resonates with the rhythm of customer satisfaction.
- Feedback Loops with Development Teams: Establishing robust feedback loops with development teams ensures the narrative of continuous improvement is a collaborative saga. It’s about ensuring the lessons from the operations realm are scripted into the software development lifecycle.
Learning from Incidents
Each incident is a chapter with valuable lessons. It’s about dissecting every incident to unearth the root cause, refining the observability strategy to better equip the SRE team for future voyages.
- Incident Management: A robust incident management process not only mitigates the impact of incidents but is a goldmine of insights. It’s about transitioning from a reactive to a proactive stance, where incidents are not just resolved but are stepping stones to elevating process maturity.
- Automating Manual Interventions: Automation is the knight in shining armor in the battle against manual intervention, saving precious engineering time, and enhancing system reliability.
Elevating Process Maturity
Elevating process maturity is about scripting a narrative of continuous improvement that’s systematic and structured. It’s a journey that transforms reactive firefighting into proactive fireproofing.
- Training and Skill Development: Investing in training and skill development of the SRE team is akin to forging the swords of knights, ensuring they are battle-ready to protect the realm of system reliability.
- Adopting New Technologies: In a realm where technology is the magic, adopting new technologies like cloud native environments and leveraging tools like AWS CloudTrail is about staying ahead in the arms race, ensuring the observability stack remains a formidable fortress against system anomalies.
Continuous improvement in SRE is a riveting narrative of advancing the observability strategy, a saga scripted with the ink of SRE best practices, enriched with the wisdom gleaned from incidents, and illuminated by the torch of elevated process maturity. It’s a narrative that ensures the tale of system reliability and performance is one of triumph and continuous evolution.
Final Thoughts on SRE Strategies for Optimal Observability
Our expedition into the realms of SRE strategies for optimal observability has been a stirring saga. We’ve traversed the triumvirate of observability – Logs, Metrics, and Traces, delved into the treasure chest of tools, and rallied alongside the gallant knights of SRE and DevOps. Enhanced observability is not merely a safe haven, but a lighthouse illuminating the path towards the coveted shores of reliability and performance.
As the melodious allure of Machine Learning resonated through our journey, we unveiled its potential to morph data into a well of foresight, prognosticating system narratives. Now, as we drop anchor, the horizon beckons with promises of implementing these strategies, venturing forth into a domain where system reliability transitions from lore to living reality. The tapestry of techniques and tools we’ve explored paves the way for not just navigating, but mastering the turbulent seas of digital operations, ensuring a voyage that’s not just resilient, but revelatory.